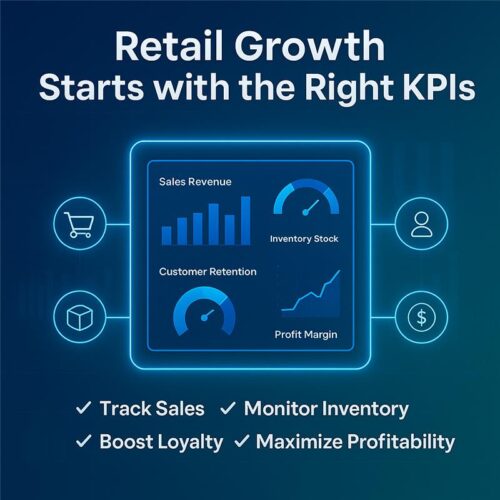
Top KPIs to Track Using Power BI in the Retail Sector
The retail sector is evolving faster than ever before. With increasing customer expectations, omnichannel shopping, and global supply chain challenges, retailers can no longer rely on guesswork. They need data-driven decision-making to thrive in a competitive marketplace.
This is where Microsoft Power BI proves invaluable. As one of the leading business intelligence (BI) and data visualization tools, Power BI enables retail businesses to track Key Performance Indicators (KPIs) in real time, providing insights that improve sales, enhance customer experiences, optimize operations, and boost profitability.
In this blog, we’ll explore the most important retail KPIs to track using Power BI and demonstrate their impact through practical case study examples.
Why KPIs Are Critical in Retail
KPIs are measurable values that reflect how effectively a business is achieving its goals. In the retail industry, KPIs ensure:
- Informed decision-making through real-time analytics.
- Better resource utilization across stores, employees, and inventory.
- Optimized customer experiences that drive loyalty and repeat sales.
- Sustained profitability by identifying trends and controlling costs.
Power BI consolidates data from diverse sources—POS systems, ERP software, CRM platforms, e-commerce sites, and even supply chain tools—into one centralized dashboard. This integration allows retailers to view KPIs holistically and take immediate action.
Top KPIs Retailers Should Track with Power BI
1. Sales Performance KPIs
Sales metrics define business health. Power BI enables retailers to track:
- Total Sales Revenue → Overall revenue across stores and channels.
- Sales by Product/Category → Identify top-performing and underperforming items.
- Average Transaction Value (ATV) → How much customers spend per transaction.
- Sales by Store/Location → Compare performance across branches or regions.
Case Study Example:
A nationwide fashion retailer used Power BI to track sales by category. Dashboards revealed that footwear sales were underperforming in urban outlets. After adjusting product placement and launching targeted promotions, footwear sales grew 18% in three months.
2. Customer Behavior & Loyalty KPIs
Customer satisfaction drives repeat business. KPIs to monitor include:
- Customer Retention Rate → Percentage of returning customers.
- Customer Lifetime Value (CLV) → Long-term revenue potential per customer.
- Net Promoter Score (NPS) → Customer satisfaction and likelihood of recommendation.
- New vs Returning Customers → Track effectiveness of acquisition vs retention.
Case Study Example:
A mid-sized electronics retailer used Power BI to compare new vs returning customers. Insights showed returning customers contributed 65% of revenue, but loyalty programs were underutilized. By enhancing rewards, the retailer boosted retention by 12% within six months.
3. Inventory & Supply Chain KPIs
Retailers need a balance between stockouts and overstocking. Power BI tracks:
- Inventory Turnover Ratio → Frequency of stock sold and replenished.
- Stockout Rate → How often items are unavailable when customers need them.
- Days of Inventory on Hand (DOH) → Average days before stock is sold.
- Supplier Lead Time → How quickly suppliers deliver goods.
Case Study Example:
A grocery chain struggled with frequent stockouts of high-demand items like dairy and packaged snacks. Power BI dashboards highlighted supplier lead time delays. After switching suppliers and optimizing reordering, stockouts fell by 30%, increasing customer satisfaction.
4. Profitability & Margin KPIs
Retailers must evaluate profitability across products, stores, and campaigns.
- Gross Profit Margin → (Revenue – Cost of Goods Sold) ÷ Revenue.
- Net Profit Margin → Profitability after expenses and taxes.
- Markdown Percentage → Discounts and their impact on margins.
- Return on Investment (ROI) → Effectiveness of campaigns and promotions.
Case Study Example:
A retail chain offering seasonal discounts used Power BI to track markdown impact. The analysis revealed certain promotions eroded margins significantly. By targeting discounts only on slow-moving inventory, they improved gross margins by 7% year-over-year.
5. Operational Efficiency KPIs
Smooth operations ensure cost savings and happy customers. Power BI helps track:
- Employee Productivity → Revenue per employee.
- Checkout Time & Queue Lengths → Measure customer experience at POS.
- Shrinkage (Loss Prevention) → Theft, damage, or administrative errors.
- Order Fulfillment Cycle Time → Duration between order placement and delivery.
Case Study Example:
A large supermarket chain implemented Power BI to monitor checkout times. Data revealed certain counters consistently processed fewer transactions per hour. After additional staff training and deploying more self-checkout kiosks, average wait times dropped by 25%, improving customer satisfaction scores.
How Power BI Empowers Retail KPI Tracking
Power BI transforms raw retail data into actionable insights. Its key benefits include:
- Real-Time Analytics → Quick response to sales dips, stockouts, or customer complaints.
- Interactive Dashboards → Drill down by store, product, or customer segment.
- Predictive Analytics → Forecast demand and optimize stock accordingly.
- Integration with Retail Systems → Connect seamlessly with ERP solutions like ERPNext, Odoo, SAP, or Microsoft Dynamics.
- Customizable Reports → Tailor dashboards for executives, managers, and staff.
The Future of Retail with Power BI
Retail is moving toward data-driven personalization, omnichannel experiences, and AI-powered forecasting. With Power BI, retailers are not only tracking KPIs but also:
- Predicting customer demand with machine learning models.
- Optimizing workforce allocation during peak seasons.
- Identifying fraud and shrinkage patterns before they escalate.
- Enhancing customer engagement with personalized offers.
Simply put, Power BI is not just a reporting tool—it’s a strategic enabler for retail success.
Final Thoughts
For retailers, tracking the right KPIs can unlock immense growth potential. From sales and customer loyalty to inventory, profitability, and operational efficiency, Power BI provides a single source of truth for decision-making.
Through real-world case applications, it’s clear that Power BI helps retailers:
- Increase revenue by identifying sales opportunities.
- Improve customer retention with data-backed loyalty strategies.
- Reduce costs by streamlining supply chain and operations.
- Enhance profitability with smarter discounting and promotions.
If your retail business is ready to embrace data-driven growth, adopting Power BI KPI dashboards is a strategic move that will position you ahead of competitors.


